The Automation Adoption Gap: What DOE Plant Assessment Data Shows
This is Part 1 of a MillBrief data series on what public plant data says about automation payback and adoption. The headline finding is simple: across U.S. Department of Energy plant assessments, factory-automation projects looked cheap to justify on paper and still went ahead far less often than the average recommendation. The payback estimate does not explain the difference. That matters if you are about to take an automation proposal to your owner, your bank or your board.
What is the Industrial Assessment Centers program?
Under the U.S. Department of Energy’s Industrial Assessment Centers (IAC) program, teams of engineering faculty and students at university-based centers have visited small and mid-size manufacturing plants since 1981, at no cost to the plant, looking for ways to cut energy use, reduce waste and improve productivity. According to the program’s operations manual (West Virginia University and Oak Ridge National Laboratory, 2016), each plant then receives a report in which every recommendation carries an estimate of the savings, the implementation cost and the simple payback.
The program then follows up. About six months after the report goes out, according to the operations manual, the center contacts the plant and asks, recommendation by recommendation, whether it was implemented. That follow-up is what makes the database useful for our question: it pairs an estimate of the business case with a record of what the plant actually decided.
Every recommendation carries a standard code. The code list (ARC Version 21.1, Rutgers University, 2022) has a group called Automation, 4.44, which covers automatic packing equipment, magazines for temporary storage, automatic boiler fuel feed, scrap collection systems, equipment to move product, automated finishing, automatic part storage and retrieval, and payroll automation. We call that group “factory automation” after removing payroll automation (4.447), which is an office function rather than a production one.
How did we analyze the data?
We used the 2023-11-20 release of the IAC database, published by DOE under a CC BY 4.0 license. The file we downloaded holds 21,000 plant assessments and 156,771 recommendations covering fiscal years 1981 to 2024. (The Data.gov catalog description gives slightly lower counts, 20,971 assessments and 156,470 recommendations, as of November 2023.)
For each recommendation we computed simple payback as the implementation cost divided by the annual dollar savings, using only rows where both were above zero. As a check, on the 92,434 rows where it could be compared with the payback field DOE publishes, our figure agreed to within 0.05 years in 99.2% of cases. For automation we left out savings streams the database marks as one-time (revenue or avoided cost that does not recur), which affected 18 of the 750 automation recommendations and did not change the median.
That left 726 factory-automation recommendations with a usable payback. For implementation, we counted recommendations recorded as implemented and divided by those recorded as either implemented or not implemented. Pending and unknown outcomes were left out, because neither is a decision. Every payback figure and implementation rate in this article, including the all-recommendation comparison, is calculated on recommendations with a usable payback, so the groups are measured the same way. The labor-savings share further down uses all 750 automation recommendations.
What did the data show?
| Recommendation group | Recommendations with payback | Median payback (years) | Payback within 2 years | Implemented |
|---|---|---|---|---|
| All IAC recommendations | 135,484 | 0.90 | 75.2% | 47.6% |
| Energy (ARC 2.x) | 122,330 | 0.93 | 74.5% | 48.5% |
| Waste (ARC 3.x) | 8,016 | 0.68 | 79.3% | 38.3% |
| Productivity (ARC 4.x) | 5,098 | 0.51 | 83.5% | 40.4% |
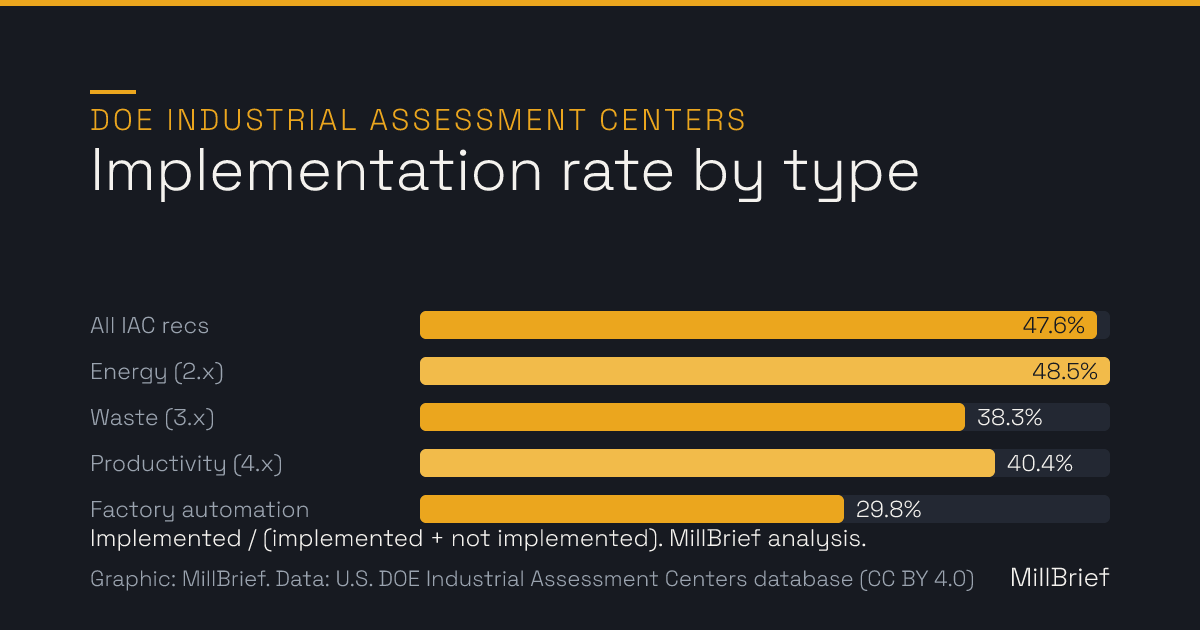
| Factory automation (ARC 4.44x, excl. 4.447) | 726 | 0.85 | 79.9% | 29.8% |
MillBrief analysis of the DOE IAC database, 2023-11-20 release. Paybacks are estimates, not measured results. Productivity (4.x) includes the automation group.
Automation paybacks were short on paper
The median factory-automation recommendation was estimated to pay back in 0.85 years, or about ten months. The middle half of the group ran from 0.31 to 1.66 years. Some 56% were estimated to pay back within one year, 79.9% within two years and 91.3% within three. On the estimates alone, that is a slightly shorter median than the 0.90 years for all IAC recommendations.
Plants went ahead with fewer than one in three
Of the 675 automation recommendations with a known outcome, plants implemented 29.8%. Across all IAC recommendations the figure was 47.6% (on 128,351 recommendations with a known outcome), about 18 percentage points higher. Automation had the lowest implementation rate of the groups in the table. Waste and productivity recommendations also had shorter median paybacks than energy ones yet were implemented less often, so across the program a shorter estimated payback did not go with more adoption. The difference between automation and the average recommendation is the most robust result in the analysis, and it is what we mean by the adoption gap.
Payback barely separated yes from no
If payback drove the decision, the projects that went ahead should have had clearly shorter paybacks. They were only slightly shorter. The 201 implemented automation recommendations had a median payback of 0.73 years, while the 474 that were not implemented had a median of 0.87 years, a difference of less than two months. Short paybacks did not rescue many projects either: of the 377 automation recommendations with a known outcome and an estimated payback of one year or less, plants implemented 115 (30.5%), about the same rate as automation overall.
The savings were mostly labor
In 68% of the 750 automation recommendations, the primary savings stream was personnel (resource code R1 in the database). In other words, most of the case for these projects rested on reducing labor hours, much like the labor term in the payback formula in our automation ROI and payback guide.
The plants were small and mid-size
The typical automation recommendation went to a plant with 130 employees, and half went to plants with between 75 and 220 employees. These are the size of shops MillBrief writes for.
A breakdown by type of project and by industry is in Part 2 of this series: which automation projects pay back fastest.
What the data cannot tell you
The obvious next question is why plants said no, and the public database does not answer it. The IAC database manual (Version 10.2) lists a set of reason codes that centers use when a recommendation is not adopted, covering things such as the upfront cost, cash flow, operating or process changes, staffing, and perceived risk to people or equipment. The same manual notes that these rejection codes are not publicly available because of confidentiality concerns. So we cannot count how often each reason came up, and nothing in this article should be read as a measured breakdown of causes.
The manual does reserve a “pending” status for recommendations costing $10,000 or more that are delayed by a large capital investment; pending items still not implemented after three years become not implemented. Pending items are excluded from our rates.
What this means if you are building an automation proposal
What follows is our interpretation. It is consistent with the numbers above, but the public data does not record why recommendations were rejected, so treat it as a working hypothesis rather than a finding.
If a short payback were enough, fast-payback automation would have been adopted at least as often as the average recommendation. It was not. That suggests the constraint for a small or mid-size plant is usually somewhere other than the payback arithmetic. In our editorial view, the likely candidates are:
- Capital approval. A project with a ten-month payback can still need a lump of cash the business does not want to commit, or a sign-off from someone who sees the spend before the savings.
- Disruption. Installing conveying, packing or finishing equipment can mean stopping or reworking a line that currently ships product. The hidden costs of automation include downtime and ramp-up losses that rarely show up in a payback estimate.
- Integration risk. The estimate assumes the equipment works as planned. Buyers who have heard about why automation projects fail may discount a payback figure for that risk, even when it is not written down.
- Staff capacity. Someone has to specify, buy, install and then maintain the equipment. In a 130-person plant that may well be the same small group already running production.
The practical consequence is about how you frame a proposal. A payback figure answers “is this worth it on paper”, which, on this evidence, does not appear to have been the main thing stopping projects. A proposal is more likely to hold up if it also covers how the purchase will be funded, what happens to output during installation, who owns commissioning and upkeep, and what the fallback is if the equipment underperforms. Build the cost side as total cost of ownership rather than an equipment quote; our TCO calculator runs in your browser for that. For the decision frame on whether to automate at all, see is automation worth it for a small manufacturer.
Finally, IAC “automation” means packing, conveying and product moving, automatic storage and retrieval, finishing and similar equipment. It is not robot cells. These figures do not replace the robot-cell payback ranges in our automation ROI and payback guide, which describe a different population of projects with different costs.
Read next: Part 2: which automation projects pay back fastest, by project type and industry.
Caveats
- The sample is old. Of the 726 automation recommendations with a usable payback, 677 date from FY1996-2005, 29 from FY2006-2015 and 20 from FY2016-2024. Median estimated payback was similar in each period (0.85, 0.91 and 0.80 years), but the two recent groups are small.
- Paybacks are estimates, not outcomes. Each one is a ratio of estimated cost to estimated annual savings, not a measured result after installation. The database manual describes the implementation cost field as client-reported and notes that it may be estimated.
- The sample probably leans toward quick paybacks. An example analysis in the operations manual notes that in most of the plants it covers, the simple-payback threshold was two years. If centers tend to recommend projects that clear a threshold like that, “79.9% within two years” partly reflects the program rather than automation itself. The adoption gap is less exposed to this, because it compares groups of recommendations that went through the same process.
- Implementation is self-reported. The plant tells the center what it did, some months after the report. “Implemented” includes projects with firm plans to finish within 12 months of the follow-up call. Pending and unknown outcomes are excluded.
- Dollars are nominal. The data spans 1981 to 2024, so we report no pooled dollar amounts. Payback is a ratio of cost to savings and is comparable across years in a way that raw dollars are not.
- Not robot cells. Do not use these figures to judge a robotic cell’s payback.
How to reproduce
Data: U.S. Department of Energy, Industrial Assessment Centers database, 2023-11-20 release (file IAC_Database.zip on the Open Energy Data Initiative), licensed under CC BY 4.0. The analysis, filtering and calculations are MillBrief’s own; DOE has not reviewed them.
We used the ASSESS sheet and the recommendation (RECC) sheets. Fields from the recommendation sheets: ARC2 (recommendation code, formatted to four decimal places before taking the first three, so codes ending in zero keep their digits), IMPSTATUS (implementation status), IMPCOST (implementation cost), PSAVED, SSAVED, TSAVED and QSAVED (dollar savings for up to four resource streams), PSOURCCODE, SSOURCCODE, TSOURCCODE and QSOURCCODE (the resource stream behind each saving), PAYBACK (the published payback, used only as a check) and FY (fiscal year). From ASSESS we joined EMPLOYEES (plant headcount) on the assessment ID.
Payback is IMPCOST divided by the sum of the four savings fields, excluding any stream coded R6 (one-time revenue or avoided cost), and computed only where both cost and savings are above zero. Implementation rate is the count of status I divided by the count of status I plus N. Factory automation is codes 4.441 to 4.448, excluding 4.447.
Frequently asked questions
What is the automation adoption gap in the IAC data?
It is the difference between how quickly automation recommendations were estimated to pay back and how often plants acted on them. In the DOE Industrial Assessment Centers database, factory-automation recommendations had a median estimated payback of 0.85 years, but plants implemented 29.8% of them (675 recommendations with a known yes or no outcome), compared with 47.6% for all IAC recommendations (MillBrief analysis).
Does this data mean automation pays back in under a year?
No. The IAC automation category covers packing equipment, product-moving equipment, scrap collection, automated finishing and automatic part storage and retrieval, not robot cells. The paybacks are estimates, not measured results, most of the sample dates from FY1996-2005, and the recommendations probably lean toward quick paybacks. Use it as evidence about adoption, not as a payback benchmark for a robot cell.
Why did plants turn down automation projects with short paybacks?
The public data does not say. The IAC database manual lists reason codes for rejected recommendations, but notes that those codes are not publicly available for confidentiality reasons. Our interpretation, which the data cannot confirm, is that capital approval, production disruption, integration risk and staff capacity weigh at least as heavily as the payback figure.
How old is the IAC automation data?
Mostly old. Of the 726 automation recommendations with a usable payback, 677 come from FY1996-2005, 29 from FY2006-2015 and 20 from FY2016-2024. Median estimated payback was similar in each period (0.85, 0.91 and 0.80 years), but the recent groups are too small to stand on their own.
What counts as implemented in the IAC database?
The plant reports it. Some months after the assessment report, the center contacts the plant and records each recommendation as implemented (done, or firmly planned within 12 months of that call), not implemented, pending, or unknown. We counted implemented divided by implemented plus not implemented, leaving pending and unknown out.
Sources
- Industrial Assessment Centers Database (catalog record) (U.S. Department of Energy, Office of Energy Efficiency & Renewable Energy, via Data.gov (CC BY 4.0), 2024-06-14)
- IAC_Database.zip (Industrial Assessment Centers Database, 2023-11-20 file) (U.S. Department of Energy, via Open Energy Data Initiative (CC BY 4.0), 2023-11-20)
- Industrial Assessment Centers Database (OEDI submission 281) (U.S. Department of Energy, via Open Energy Data Initiative (CC BY 4.0))
- IAC Assessment Database Manual, Version 10.2 (Center for Advanced Energy Systems, Rutgers University, for the U.S. Department of Energy, October 2011)
- Industrial Assessment Center Assessment Recommendation Codes (ARC), Version 21.1 (Rutgers University, for the U.S. Department of Energy, January 2022)
- Industrial Assessment Center (IAC) Operations Manual (Industrial Assessment Center, West Virginia University, and Oak Ridge National Laboratory, November 2016)