Which Automation Projects Pay Back Fastest? DOE Plant Audit Data
- Food Beverage
- Plastics Rubber
- Metal Fabrication
This is Part 2 of a MillBrief data series on what public plant data says about automation payback and adoption. Part 1 found that factory-automation recommendations in U.S. Department of Energy plant assessments had a median estimated payback of 0.85 years, yet plants implemented only 29.8% of them, against 47.6% for all recommendations. This part breaks the same 726 automation recommendations down by type of project and by industry, looks at what the savings consisted of, and sets a European survey of robot users alongside as context. If you are pricing packing, product-moving or finishing equipment, this is the part that gets closest to your project.
Where do these numbers come from?
The data is the DOE Industrial Assessment Centers (IAC) database, 2023-11-20 release (CC BY 4.0). University teams visit small and mid-size plants, write up recommendations with an estimated cost, savings and payback, and later record whether the plant went ahead. Part 1 explains the program and our method in full; the method is unchanged. In brief, payback is implementation cost divided by annual dollar savings, and the implementation rate counts implemented against implemented plus not implemented, leaving pending and unknown outcomes out.
“Factory automation” is the IAC Automation group (codes 4.441 to 4.448) without payroll automation (4.447). We use short names for the types in the code list (ARC Version 21.1):
- Packing: install automatic packing equipment (4.441).
- Product moving: install equipment to move product (4.445).
- Finishing: automate finishing process (4.446).
- Scrap collection: install system to collect scrap (4.444).
- AS/RS: install automatic part storage / retrieval system (4.448).
Magazines for temporary storage (4.442) and automatic boiler fuel feed (4.443) have 17 recommendations with a usable payback between them, too few to discuss. We report a group as a finding only when it has at least 30 recommendations; AS/RS, with 26, is shown for completeness and flagged.
Which automation projects paid back fastest?
| Project type (ARC code) | Recommendations with payback | Median payback (years) | Middle half (years) | Payback within 1 year | Implemented (known outcomes) |
|---|---|---|---|---|---|
| Packing (4.441) | 300 | 1.05 | 0.45-1.99 | 48.0% | 29.5% (83 of 281) |
| Product moving (4.445) | 220 | 0.69 | 0.21-1.46 | 64.5% | 27.5% (56 of 204) |
| Finishing (4.446) | 121 | 0.96 | 0.28-1.74 | 50.4% | 28.3% (32 of 113) |
| Scrap collection (4.444) | 42 | 0.35 | 0.11-0.97 | 76.2% | 39.5% (15 of 38) |
| AS/RS (4.448), small group | 26 | 0.49 | 0.21-1.61 | 65.4% | 34.8% (8 of 23) |
| All factory automation | 726 | 0.85 | 0.31-1.66 | 55.9% | 29.8% (201 of 675) |
MillBrief analysis of the DOE IAC database, 2023-11-20 release. Paybacks are estimates, not measured results. “Middle half” is the range from the 25th to the 75th percentile.
Scrap collection was quickest, packing slowest
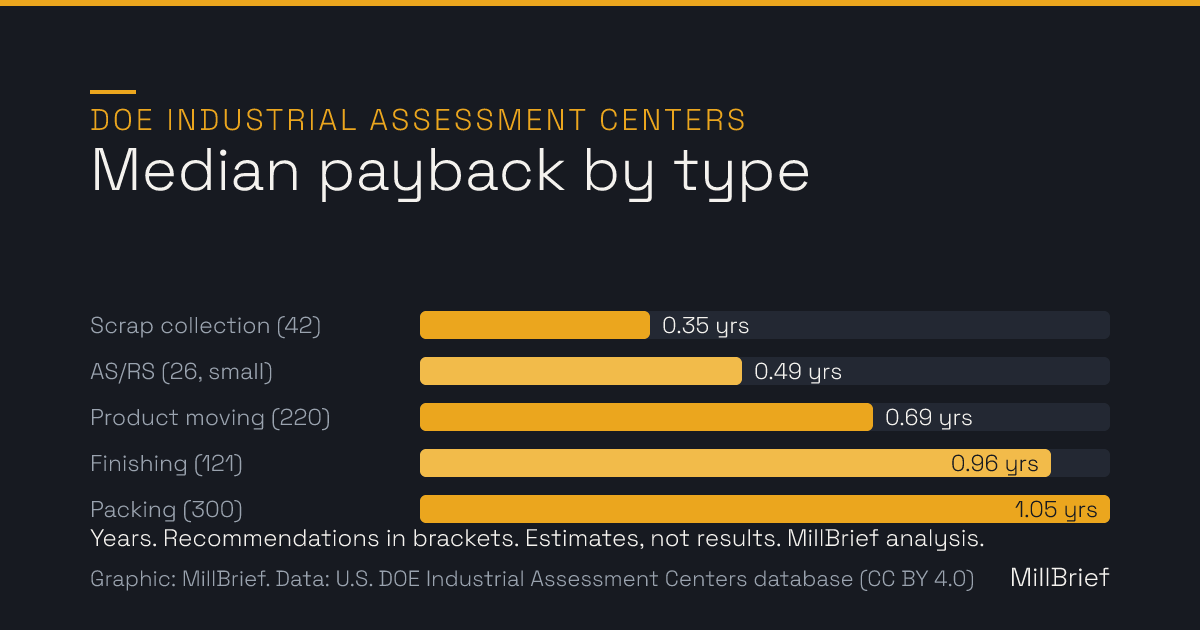
Scrap collection systems had a median estimated payback of 0.35 years, about four months, and 76.2% were estimated to pay back within a year. The group is modest (42 recommendations), so treat the exact figure loosely, but even its upper quartile (0.97 years) sat below the packing median. Among the three large groups, product moving had the shortest median (0.69 years, 220 recommendations), then finishing (0.96 years, 121) and packing (1.05 years, 300). AS/RS showed 0.49 years, but on only 26 recommendations, 25 of them from FY2000-2005; we would not build anything on it.
The spread inside each type is wider than the gap between types
The more useful number for a buyer may be the middle half: 0.45 to 1.99 years for packing, 0.21 to 1.46 years for product moving. The gap between the fastest and slowest medians of the three large types is 0.36 years, far less than the spread inside any one of them. In this data, the type of project told you less about payback than the specifics of the individual project did.
Did faster payback mean more projects went ahead?
Not clearly. Scrap collection had both the shortest median payback and the highest implementation rate, 39.5%, but that rests on 38 known outcomes, and the true rate could plausibly be anywhere from about 26% to 55% (a 95% confidence interval). Packing, product moving and finishing, with medians from 0.69 to 1.05 years, were implemented at almost the same rates: 29.5%, 27.5% and 28.3%. A standard chi-square test on the five types does not distinguish the differences from chance.
Within each type, the pattern from Part 1 repeats: payback barely separates the projects that went ahead from those that did not. Implemented packing recommendations had a median payback of 1.02 years against 1.06 years for those not implemented; for finishing, 0.98 against 0.94 years. Product moving showed the largest difference, 0.48 years (56 implemented) against 0.73 years (148 not implemented), but a Mann-Whitney test does not rule out chance there either.
How did payback vary by industry?
We grouped recommendations by the plant’s two-digit Standard Industrial Classification (SIC) code and kept the nine groups with at least 30 automation recommendations. Together they hold 570 of the 726; the other 156 are spread across smaller groups.
| Industry (SIC major group) | Recommendations with payback | Median payback (years) | Middle half (years) | Implemented (known outcomes) | Most common project type |
|---|---|---|---|---|---|
| Paper and allied products (26) | 38 | 0.63 | 0.38-1.13 | 33.3% (11 of 33) | Packing (17) |
| Rubber and miscellaneous plastics products (30) | 115 | 0.67 | 0.25-1.46 | 30.2% (32 of 106) | Packing (54) |
| Fabricated metal products (34) | 67 | 0.71 | 0.33-1.41 | 25.8% (16 of 62) | Product moving (24) |
| Electronic and other electrical equipment (36) | 31 | 0.83 | 0.32-1.55 | 32.1% (9 of 28) | Finishing (12) |
| Primary metal industries (33) | 51 | 0.99 | 0.51-1.75 | 20.0% (10 of 50) | Product moving (28) |
| Food and kindred products (20) | 143 | 1.00 | 0.38-2.01 | 30.3% (40 of 132) | Packing (102) |
| Industrial and commercial machinery (35) | 47 | 1.00 | 0.36-1.79 | 30.4% (14 of 46) | Packing (19) |
| Lumber and wood products (24) | 48 | 1.05 | 0.35-2.17 | 35.6% (16 of 45) | Product moving (22) |
| Chemicals and allied products (28) | 30 | 1.15 | 0.55-1.73 | 37.0% (10 of 27) | Packing (17) |
MillBrief analysis of the DOE IAC database, 2023-11-20 release. Industry names are SIC major group titles, some shortened. Groups of 30 to 50 recommendations are small; read their figures as rough.
Medians ran from 0.63 years in paper to 1.15 years in chemicals. Two cautions apply before reading anything into that ordering.
First, an industry figure is partly a project-mix figure. In food, 102 of the 143 recommendations were packing equipment, so the food median of 1.00 years is close to a packing median. In primary metals, 28 of 51 were product-moving equipment.
Second, implementation rates by industry, from 20.0% in primary metals to 37.0% in chemicals, sit on 27 to 132 known outcomes each, and a chi-square test does not distinguish the differences from chance. All nine are well below the 47.6% for IAC recommendations as a whole.
What were the savings?
Part 1 reported that in 68% of the 750 automation recommendations, the primary savings stream was personnel (resource code R1); exactly, 508 of 750, or 67.7%. Counting any of the four savings streams, 536 (71.5%) included a personnel saving. The next most common primary streams were administrative costs (code R2, 102 recommendations) and primary product (code P1, changes to production cost per unit or production time, 68).
By type, personnel was the primary stream in 73.7% of packing (227 of 308), 69.1% of finishing (85 of 123), 66.2% of product moving (151 of 228) and 62.5% of scrap collection (30 of 48) recommendations. AS/RS was the exception, on small numbers: personnel in 7 of 26 and administrative costs in 15. The IAC database manual defines administrative costs as fees or charges not directly related to production, including inventory control.
So most of these payback estimates stand or fall on the labor term, the same term our automation ROI and payback guide tells you to build from fully burdened wages and hours you can actually take out.
What European robot users say (context, not a comparison)
For a second view, we looked at Eurostat’s survey of ICT use in enterprises, which asks whether firms use robots and, in 2022, why. It is a different population and measure: it counts EU firms with 10 or more employees in 2022, not recommendations from U.S. plant audits of mostly 1996-2005, and it covers industrial and service robots, which IAC automation does not. Its figures should not be compared with the IAC payback or implementation numbers.
In 2022, 16.3% of EU27 manufacturing enterprises with 10 or more employees used industrial robots, and 17.6% used industrial or service robots (16.1% and 17.4% for industrial robots in 2018 and 2020).
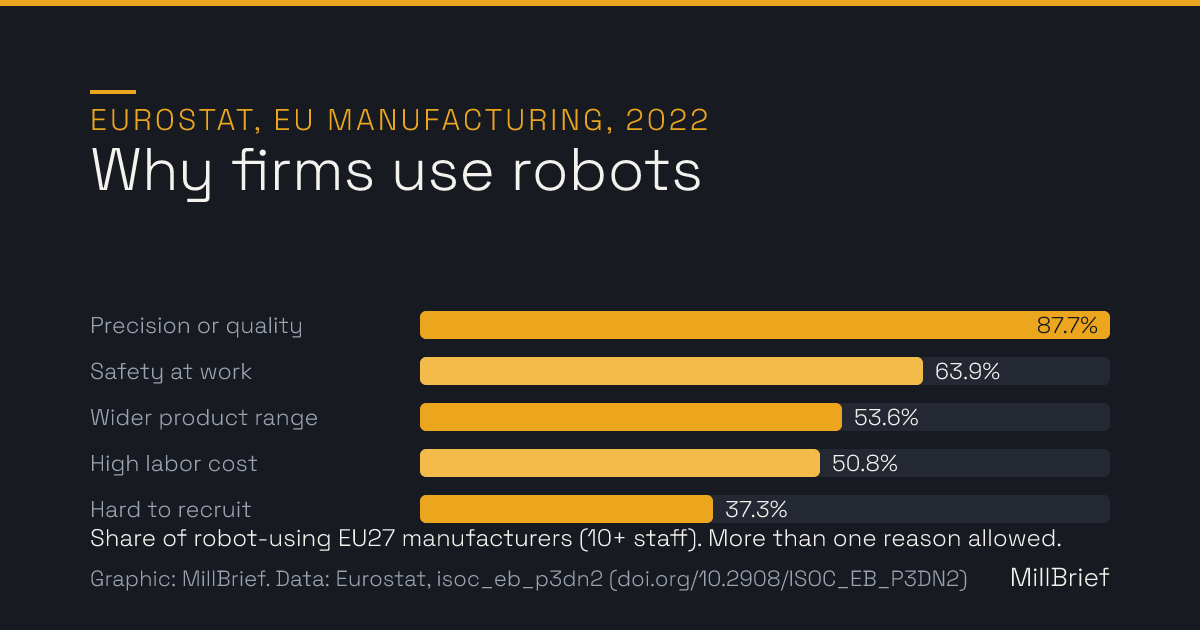
Among manufacturers that used robots, the reason given most often was precision or standardized quality (87.7%), followed by safety at work (63.9%) and expanding the range of goods or services (53.6%). High labor cost was given by 50.8%, difficulty recruiting by 37.3%, and tax or other government incentives by 17.1%. Firms could give more than one reason.
The contrast we find useful is one of emphasis, not of numbers. The IAC estimates mostly count labor; European robot users, asked why, put quality and safety ahead of labor cost. Our reading, which neither dataset can prove, is that the benefits easiest to put into a payback formula are not necessarily the ones that decide whether a plant is glad it automated.
What a buyer can take from this
What follows is our interpretation. It is consistent with the numbers above, but the data describes estimates for older, mostly non-robotic projects, so treat it as prompts for your own case rather than benchmarks.
- Use the type medians as a sense check, not a target. If a quote for similar equipment shows a payback far outside the ranges above, ask which assumptions drive the difference. A different payback is not wrong in itself: your wages, volumes and prices are not those of a 1990s or early-2000s plant.
- Expect your project to differ from its category. The spread within each type was wider than the gap between types, so your own labor hours, shifts and volume will likely matter more than the label. Our guide to what to automate first covers picking the task.
- Check the labor term first. In about two thirds of these recommendations the main saving was personnel. Rebuild it from fully burdened wages and hours you can genuinely remove or avoid hiring.
- List the other benefits separately. Where you can measure quality or safety gains, for example scrap or rework you already track, they can go in the case. Where you cannot, it is safer to list them next to the payback figure than to fold guesses into it.
- Price the whole project. A payback built on an equipment quote alone will look better than one built on installed cost. See the hidden costs of automation and our TCO calculator.
- A short payback may not carry the proposal on its own. As Part 1 showed, and as this breakdown repeats by type and industry, faster-payback automation was not clearly implemented more often. Funding, disruption and who will own the equipment probably matter as much.
Finally, IAC “automation” means packing, product moving, scrap collection, finishing and part storage equipment. It is not robot cells. None of these figures replaces the robot-cell payback ranges in our automation ROI and payback guide, which describe a different population of projects with different costs.
Read next: Part 3: why good paybacks go unbuilt, with U.S., UK and Dutch implementation data.
Caveats
- The sample is old. Of the 726 automation recommendations with a usable payback, 677 date from FY1996-2005, 29 from FY2006-2015 and 20 from FY2016-2024. By type, 286 of 300 packing, 201 of 220 product-moving and 110 of 121 finishing recommendations are from FY2005 or earlier.
- Paybacks are estimates, not outcomes. Each is a ratio of estimated cost to estimated annual savings. The database manual describes the implementation cost field as client-reported and notes that it may be estimated.
- The sample probably leans toward quick paybacks. An example analysis in the IAC operations manual notes that in most of the plants it covers, the simple-payback threshold was two years. If centers tend to recommend projects that clear a threshold like that, the short medians partly reflect the program rather than the equipment.
- Small groups. Groups of 30 to 50 recommendations give rough figures, and AS/RS (26) falls below our threshold. Differences in implementation rate between types and between industries are within what chance could produce.
- Implementation is self-reported. The plant tells the center what it did some months after the report. Pending and unknown outcomes are excluded.
- Dollars are nominal. The data spans 1981 to 2024, so we report no pooled dollar amounts. Payback is a ratio and is comparable across years in a way that raw dollars are not.
- Not robot cells. Do not use these figures to judge a robotic cell’s payback.
- The Eurostat figures are context only. They measure the share of EU firms using robots and the reasons those firms gave in a 2022 survey. They are not comparable with IAC paybacks or implementation rates.
How to reproduce
IAC data: U.S. Department of Energy, Industrial Assessment Centers database, 2023-11-20 release (file IAC_Database.zip on the Open Energy Data Initiative), licensed under CC BY 4.0. The analysis, filtering and calculations are MillBrief’s own; DOE has not reviewed them. Fields, payback and implementation definitions are as described in the “How to reproduce” section of Part 1. Project type is the recommendation code ARC2, formatted to four decimal places and cut to its first three decimals. Industry is the SIC field from the ASSESS sheet, divided by 100 and truncated to its two-digit major group. Quartiles use linear interpolation. The personnel share uses all 750 automation recommendations and the primary savings stream code (PSOURCCODE equal to R1); the other figures use the 726 with a usable payback.
Eurostat data: dataset isoc_eb_p3dn2, “3D printing and robotics by NACE Rev. 2 activity” (DOI 10.2908/ISOC_EB_P3DN2, data updated 2025-12-11), accessed through the Eurostat dissemination API on 2026-10-01. Dimensions used: geo EU27_2020, nace_r2 C (manufacturing), size_emp GE10. Robot use: indic_is E_RBTI and E_RBT, unit PC_ENT. Reasons: indic_is E_RBTWHP, E_RBTWES, E_RBTWER, E_RBTWHCL, E_RBTWDR and E_RBTWTI, unit PC_ENT_RBT (percentage of enterprises using industrial or service robots), year 2022. Source: Eurostat. Eurostat permits reuse of its data provided the source is acknowledged.
Frequently asked questions
Which type of factory automation paid back fastest in the IAC data?
Among the types with at least 30 recommendations, scrap collection systems had the shortest median estimated payback, 0.35 years (42 recommendations), followed by equipment to move product (0.69 years, 220), automated finishing (0.96 years, 121) and automatic packing equipment (1.05 years, 300). Automatic part storage and retrieval (AS/RS) had a median of 0.49 years, but on only 26 recommendations. These are estimates from DOE Industrial Assessment Center reports, mostly from FY1996-2005 (MillBrief analysis).
Did faster-payback automation get implemented more often?
Not clearly. Scrap collection had both the shortest median payback and the highest implementation rate (39.5%, 15 of 38 recommendations with a known outcome), but that group is small. Packing, product moving and finishing were implemented at 27.5% to 29.5% despite medians ranging from 0.69 to 1.05 years. A chi-square test does not distinguish the differences between types from chance.
Which industries had the fastest automation paybacks in the IAC data?
Of the nine industry groups with at least 30 automation recommendations, paper and allied products had the shortest median estimated payback (0.63 years, 38 recommendations), then rubber and miscellaneous plastics (0.67 years, 115) and fabricated metal products (0.71 years, 67). Chemicals had the longest (1.15 years, 30). Industry figures largely reflect which project types each industry was offered: 102 of the 143 food-industry recommendations were packing equipment.
What savings did IAC automation recommendations count on?
Mostly labor. In 508 of the 750 automation recommendations (67.7%), the primary savings stream was personnel (resource code R1). Packing had the highest share (73.7%). Automatic part storage and retrieval was the exception: its primary stream was administrative costs, which the IAC manual says include inventory control, in 15 of 26 recommendations.
Can I use these paybacks for a robot cell?
No. IAC automation covers packing, product moving, scrap collection, finishing and part storage equipment, not robot cells, and the paybacks are estimates from mostly 1996-2005 assessments that probably lean toward quick paybacks. For robot cells, use the ranges in MillBrief's automation ROI and payback guide and build your own numbers.
Sources
- Industrial Assessment Centers Database (catalog record) (U.S. Department of Energy, Office of Energy Efficiency & Renewable Energy, via Data.gov (CC BY 4.0), 2024-06-14)
- IAC_Database.zip (Industrial Assessment Centers Database, 2023-11-20 file) (U.S. Department of Energy, via Open Energy Data Initiative (CC BY 4.0), 2023-11-20)
- Industrial Assessment Centers Database (OEDI submission 281) (U.S. Department of Energy, via Open Energy Data Initiative (CC BY 4.0))
- IAC Assessment Database Manual, Version 10.2 (Center for Advanced Energy Systems, Rutgers University, for the U.S. Department of Energy, October 2011)
- Industrial Assessment Center Assessment Recommendation Codes (ARC), Version 21.1 (Rutgers University, for the U.S. Department of Energy, January 2022)
- Industrial Assessment Center (IAC) Operations Manual (Industrial Assessment Center, West Virginia University, and Oak Ridge National Laboratory, November 2016)
- SIC Manual (Standard Industrial Classification, major group titles) (U.S. Department of Labor, Occupational Safety and Health Administration)
- 3D printing and robotics by NACE Rev. 2 activity (isoc_eb_p3dn2), DOI 10.2908/ISOC_EB_P3DN2, accessed 2026-10-01 (Eurostat, 2025-12-11)
- Eurostat copyright notice and free reuse of data (Eurostat)