Why Good Paybacks Go Unbuilt: US, UK and Dutch Implementation Data
This is Part 3 of a MillBrief data series on what public plant data says about automation payback and adoption. Part 1 found that U.S. plants implemented only 29.8% of factory-automation recommendations from Department of Energy assessments, against 47.6% of all recommendations, despite a median estimated payback of 0.85 years. Part 2 found the same gap by project type and industry. This part asks whether that is a quirk of one program: how often do projects with a good payback get built, and what stops the rest?
We use three public programs that record what firms did after being shown cost-effective measures: the U.S. Industrial Assessment Centers, the UK’s Energy Savings Opportunity Scheme (ESOS) and the Dutch energy-saving obligation (energiebesparingsplicht). One warning first. Only the U.S. data includes automation. The UK and Dutch figures are about energy-saving measures in buildings, industrial processes and transport, and the three programs count different things. They show a common pattern, not a league table.
Three programs, three different questions
| U.S.: DOE Industrial Assessment Centers | UK: ESOS | Netherlands: energiebesparingsplicht | |
|---|---|---|---|
| Who | Small and mid-size manufacturing plants, assessed free by university teams | Large organisations (over 250 staff, or turnover above £44m and balance sheet above £38m) | Locations using at least 50,000 kWh of electricity or 25,000 m3 of gas (equivalent) a year |
| What is counted | Each recommendation in the assessment report | Each measure the organisation put in its own action plan | Each measure from a government list that applies to the location |
| Must the firm act? | No | It must plan and report; it chooses the measures and dates | Yes, on all measures paying back in 5 years or less |
| Implemented | 47.6% of all recommendations; 29.8% of factory automation | 56.6% of planned measures that were due | 68.4% fully, 2.5% another way, 8.7% partly, 20.4% not (yet) |
All rates are MillBrief calculations from the DOE IAC database (2023-11-20 release), Environment Agency ESOS files (dated 2026-06-05) and RVO’s answers file (1 May 2026). Outcomes are self-reported. The rates measure different things and should not be ranked.
U.S.: payback predicted adoption, except for automation
The IAC database pairs each recommendation’s estimated payback with what the plant later said it did. As in Part 1, payback is implementation cost over annual dollar savings, and the implementation rate is implemented over implemented plus not implemented, leaving pending and unknown outcomes out.
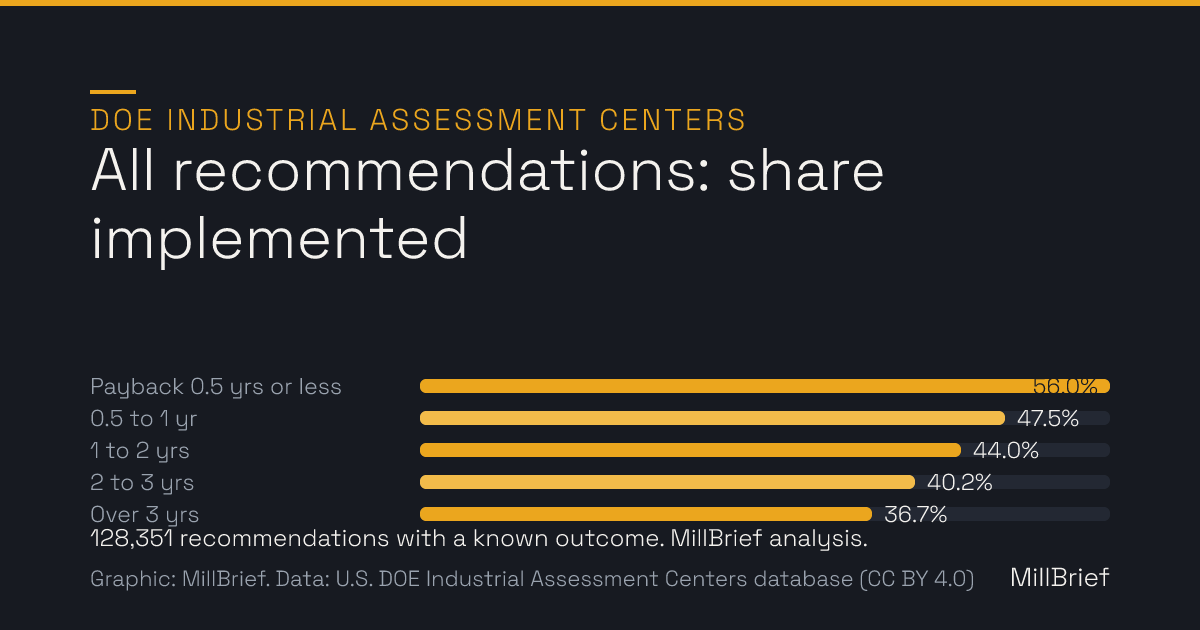
| Estimated payback | All recommendations: implemented | Factory automation: implemented |
|---|---|---|
| 0.5 years or less | 56.0% (25,804 of 46,049) | 34.0% (81 of 238) |
| 0.5 to 1 year | 47.5% (10,941 of 23,011) | 24.5% (34 of 139) |
| 1 to 2 years | 44.0% (12,237 of 27,836) | 29.4% (47 of 160) |
| 2 to 3 years | 40.2% (6,013 of 14,967) | 32.9% (26 of 79) |
| Over 3 years | 36.7% (6,052 of 16,488) | 22.0% (13 of 59) |
| All | 47.6% (61,047 of 128,351) | 29.8% (201 of 675) |
MillBrief analysis of the DOE IAC database, 2023-11-20 release. Factory automation is codes 4.441 to 4.448 excluding payroll automation (4.447).
Across all recommendations, shorter payback went with more implementation, step by step. Factory automation did not follow the slope: its rate stayed between 22.0% and 34.0% in every band, and a chi-square test does not distinguish the differences between bands from chance (p about 0.2). Automation estimated to pay back within six months was implemented 34.0% of the time, less often than the average recommendation in the slowest band (36.7%).
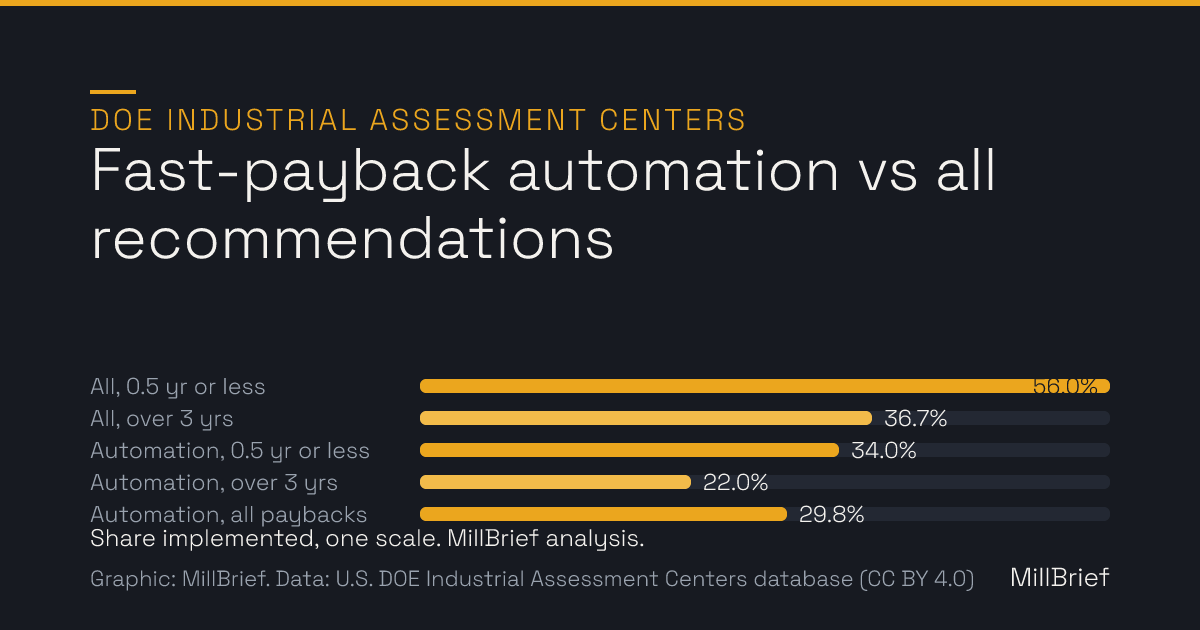
So payback does carry information about what gets built, but for automation something else outweighed it. The database cannot say what. The IAC manual lists rejection reasons such as cash flow, lack of staff and suspected risk to equipment or product, but notes that the rejection codes “are not publicly available due to confidentiality concerns”. For reasons, we turn to the other two programs.
UK: what large organisations did with their own plans
ESOS requires large UK organisations to audit their energy use at least every four years. Since the 2023 rules they must also write an action plan setting out each measure “the participant proposes to implement” and “the date by which the participant proposes to implement” it, then file progress updates saying which planned measures were implemented and whether on time. These are measures the organisations chose, mostly from their own audit.
The Environment Agency publishes the plans and first progress updates. The files we used, dated 5 June 2026, cover plans for 6 December 2023 to 5 December 2027 (the Agency’s “Phase 3” files): 30,481 measure-level answers in 5,609 updates, most filed near the 5 December 2025 deadline (median 2 December 2025).
The headline rate understates what was done
Asked “Has the measure been implemented?”, organisations answered yes for 7,301 measures and no for 12,665: 36.6%. For manufacturers (UK SIC divisions 10 to 33; 5,682 measures from 792 organisations) it is 37.6%. Matching each answer back to its date in the action plan shows why that understates progress:
- Most “no” answers were not yet due. Of the 12,665, 8,382 (66.2%) had a planned date after the month of the update. A “no” for a measure planned for 2027 is not a decision against it.
- The blanks look like work already done. Another 10,515 answers are blank. 1,919 are measures newly added in the update. The other 8,596 all answer “yes” to a second question, whether the measure was done by its planned date, and every one we could match (8,236) has a planned date earlier than the month the plan was submitted; no yes or no answer has a date that early. Our reading, which the Agency does not document, is that these were done before the plan was written. The regulation asks the first update about measures implemented since the plan was notified, so there was nothing to report. We do not count them as implemented.
Measures that were due: 56.6% done
Of measures whose planned date had arrived by the month of the update, organisations had implemented 56.6% (5,030 of 8,880); manufacturers, 56.2% (970 of 1,727). Leaving out measures planned for the update month itself gives 61.3% and 60.5%. Of the 5,030 done, 743 were late. Some firms were ahead: 19.5% of measures not yet due were already done.
Measures the organisation said came from its audit were implemented less often than measures added for other reasons: 54.7% (3,583 of 6,556) against 62.3% (1,447 of 2,324). That fits the idea that an assessor’s suggestion is a weaker commitment than a project the firm already wanted, though the data cannot prove it.
So about four in ten measures that large organisations had put in their own plans, with their own dates, were not done when the date came.
Why ESOS measures stall
A UK government evaluation of the previous ESOS phase (BEIS Research Paper 2020/005, surveys and case studies, before action plans existed) describes why audit recommendations went unbuilt:
- Internal payback rules. Assessors were sometimes told the client’s acceptable payback in advance, which “could vary anywhere from 1 year up to a maximum of 5 years”. One assessor reported a usual cut-off of four years.
- Doubt about the estimates. One case-study organisation “believed the payback periods in the report were unrealistically short reflecting a lack of understanding of their processes by the assessor.”
- Capital. “Lack of availability of capital can be a major barrier to uptake of energy efficiency measures, even if they make business sense.”
- Equipment life. Firms tend not to replace “relatively new and functioning” equipment, and buy efficient kit at end of life.
- Competing priorities. Other investments “can yield greater productivity gains”, “particularly the case for process changes”. One lead assessor contrasted easy items such as meters with a new pump at a chemical plant, which needs “significant capital investment and technical project evaluation”.
Netherlands: when a 5-year payback is a legal duty
The Dutch case removes the choice. The Bal and Bbl regulations require businesses and institutions above the energy threshold to carry out “alle energiebesparende maatregelen met een terugverdientijd van 5 jaar of minder” (all energy-saving measures with a payback of 5 years or less). Most report against a list of recognised measures, saying for each one that applies whether it was carried out fully, partly, another way, or not (yet).
| Status (RVO file, 1 May 2026) | All sectors | Industry sector |
|---|---|---|
| Fully carried out (volledig) | 68.4% | 66.6% |
| Carried out another way (alternatief) | 2.5% | 3.2% |
| Partly (gedeeltelijk) | 8.7% | 10.5% |
| Not (yet) carried out ((nog) niet) | 20.4% | 19.7% |
| Applicable measures | 1,280,865 | 215,848 |
MillBrief calculation from RVO, “Gegeven antwoorden per toepasselijke erkende maatregel, 1 mei 2026”, sheet “Sectoren - Categorieën”. Self-reported.
RVO’s facts page summarises: “Van deze maatregelen voerde de doelgroep ongeveer 71% volledig, 9% gedeeltelijk en 20% (nog) niet uit” (of these measures, the target group carried out about 71% fully, 9% partly and 20% not (yet)). The 71% appears to include alternative implementations; the file gives 70.9% for the two together. The page adds that about 70% of the measures concern buildings, and that the reports came from about 55% of the locations estimated to be required to file one. RVO also notes that more measures get carried out over time and that the reports are usually not updated for this, so the shares above may understate later progress.
RVO’s March 2026 results report adds three details:
- Most of what was done was done early. “87% van de volledige uitgevoerde maatregen zijn al in 2020 of eerder uitgevoerd” (87% of fully implemented measures were already done in 2020 or earlier).
- The rest often has no date. Asked when open measures would be done, “Bij bijna 60% van de maatregelen kon men dit echter niet aangeven” (for almost 60% of the measures, they could not say).
- Preconditions and timing. Beyond the applicable measures, about 103,000 measures were reported as not done because preconditions were not met, and of the roughly 190,000 unmet preconditions selected, “55% technisch van aard en 45% economisch” (55% technical, 45% economic). About 73,000 times, a measure that pays back only at a “natural moment” (natuurlijk moment) was reported as waiting for it.
The largest energy users file a fuller study (onderzoeksplicht). Their reports identified 15,421 cost-effective measures still to do; a conditional barrier was reported for 60% of them, and for those paying back in 5 years or less, “circa de helft” (about half) of the barriers were technical.
Even under a legal duty with a 5-year limit, about one in five applicable measures had not been carried out when reported.
What the three programs have in common
This section is our interpretation. The programs differ in population, period, measure type and definitions, so it is the pattern that carries over, not the percentages.
A good payback is necessary but not sufficient. Even at six months or less, 44% of all U.S. recommendations and 66% of automation recommendations were not implemented. In the UK, four in ten due measures that firms had chosen themselves were not done. In the Netherlands, a legal duty still left about a fifth undone.
The reasons given are mostly not the payback arithmetic. Capital, technical conditions, equipment life, doubts about the estimate and competing projects come up across the UK evaluation and the Dutch reports. The U.S. database records reasons of a similar kind but does not publish them.
Bigger, more disruptive changes seem to stall more. Dutch firms did most of their measures early, and technical conditions led the unmet preconditions; the UK evaluation contrasts meters with a new pump. Factory automation sits at the disruptive end: it changes how people work, needs commissioning and touches production. That may help explain its flat, low U.S. adoption, though no dataset here tests it.
What a buyer can take from this
Our interpretation, as prompts rather than rules:
- Treat payback as the entry ticket, not the case. Clearing your threshold is only the first test. Our automation ROI and payback guide covers building the number itself.
- Check the estimate before anyone else does. One UK case-study firm thought its audit paybacks unrealistically short for its process. Rebuild labor and throughput from your own figures and price the installed project, not the equipment quote: see the hidden costs of automation and our TCO calculator.
- Name the funding route. Money came up in both programs that published reasons. Say whether the project is budgeted, leased, financed or phased, and what it displaces.
- List the technical preconditions up front. Floor space, utilities, part presentation, product variation and controls integration are the automation version of the Dutch technical preconditions. If one is unmet, the payback is hypothetical. Our list of why automation projects fail is a starting checklist.
- Time it to the equipment you have. UK firms waited for end of life, and Dutch firms for the natural moment. If the machine you would automate around is due for replacement, that is a cheaper moment to change the process.
- Give it an owner and a date. UK measures with a planned date were still missed about four times in ten. A named owner and a review point cost little and make a slipped date visible.
If you are still deciding whether to automate at all, start with is automation worth it for a small manufacturer.
Caveats
- UK and Dutch figures are energy measures, not automation. ESOS audits cover buildings, industrial processes and transport; RVO’s examples range from insulating the building shell to energy-efficient product cooling. About 70% of the Dutch measures concern buildings.
- IAC automation is not robot cells. It means packing, product moving, scrap collection, finishing and part storage equipment, mostly assessed in FY1996-2005 (677 of 726 recommendations).
- The programs are not like-for-like. Outside assessors’ recommendations to small U.S. plants; measures large UK organisations chose for their own plans; listed measures under a Dutch legal duty. Their rates should not be ranked.
- Everything is self-reported, and Dutch reports are usually not updated after later work.
- The UK blank interpretation is ours. The Environment Agency does not document why the answer is blank; our reading rests on the data pattern and the wording of regulation 34B. No blank is counted as implemented.
- UK timing is approximate. Planned dates are month and year. Measures were matched to the plan by plan ID and measure name; 765 duplicated plan entries were set aside.
- UK manufacturing is by the organisation’s first SIC code, so some measures may be at offices or warehouses.
- Implementation is not savings. None of these rates says whether savings were achieved.
How to reproduce
U.S.: DOE Industrial Assessment Centers database, 2023-11-20 release (CC BY 4.0), with the fields and definitions in Part 1. Payback bands are right-closed (0.5 to 1 year means over 0.5, up to 1.0). The chi-square test is a 5 by 2 test on implemented and not implemented automation counts. DOE has not reviewed our analysis.
UK: Environment Agency, Energy Savings Opportunity Scheme dataset, files “Energy_Savings_Opportunity_Scheme_Phase_3_20260605.xlsx”, “Action_Plan_Published_Data_Phase3_20260605.xlsx” and “PU1_Report_Public_Data_Phase_3_20260605 published.xlsx”, downloaded 2026-10-06. Join progress-update measures to updates on PU1 ID, to action plans on AP ID, and to the organisation sheet “Responsible Undertaking” on NOC ID. Manufacturing: classification type SIC with a five-digit first code starting 10 to 33. Planned date: action plan sheet “Energy Efficiency Measures”, column “Implementation Date”, matched on AP ID and trimmed measure name. Due: planned month from the plan’s submission month up to the update’s submission month. Contains public sector information licensed under the Open Government Licence v3.0.
Netherlands: RVO (Netherlands Enterprise Agency), “Gegeven antwoorden per toepasselijke erkende maatregel, 1 mei 2026”, sheet “Sectoren - Categorieën”, “Total” rows for “Alle sectoren” and “Sector Industrie”. Quotes are from RVO’s facts page and its March 2026 report “Resultaten energiebesparingsplicht”. Source: RVO. Translations are MillBrief’s.
Frequently asked questions
Do projects with a shorter payback get implemented more often?
Across all U.S. DOE Industrial Assessment Center recommendations, yes, steadily: plants implemented 56.0% of recommendations with an estimated payback of half a year or less and 36.7% of those over three years. Factory automation did not follow that pattern. Its implementation rate stayed between 22.0% and 34.0% in every payback band, and the differences between bands are within what chance could produce (MillBrief analysis).
How many ESOS action plan measures have UK organisations implemented?
In the first progress updates published by the Environment Agency, organisations answered yes for 7,301 of 19,966 measures (36.6%). Most of the no answers, though, were for measures planned for a later date. Of the measures whose planned date had arrived by the month of the update, 56.6% had been implemented (5,030 of 8,880), and 56.2% for manufacturers. These are energy measures, not automation, and the answers are self-reported.
What is the Dutch energy-saving obligation?
Dutch rules require businesses and institutions using at least 50,000 kWh of electricity or 25,000 m3 of natural gas (equivalent) a year at a location to carry out all energy-saving measures with a payback of 5 years or less, and to report on them every 4 years. In reports to 1 May 2026, 68.4% of about 1.28 million applicable recognised measures were fully carried out, 2.5% done in an alternative way, 8.7% partly and 20.4% not (yet).
Why do cost-effective projects go unbuilt?
The public data points to reasons other than the payback figure. A UK government evaluation of ESOS described firms rejecting measures above an internal payback threshold, doubting the assessor's payback estimates, lacking capital, and waiting to replace equipment at the end of its life. Dutch reports cited technical (55%) and economic (45%) preconditions that were not met. The U.S. DOE database records rejection reasons, but they are not public.
Do these UK and Dutch figures apply to automation projects?
Not directly. The UK and Dutch figures cover energy-saving measures, in buildings, industrial processes and transport, and about 70% of the Dutch measures relate to buildings. Only the U.S. figures include factory automation, and that means packing, product moving, scrap collection, finishing and part storage equipment, not robot cells. The three programs also count different things, so their rates should not be ranked against each other.
Sources
- Industrial Assessment Centers Database (catalog record) (U.S. Department of Energy, Office of Energy Efficiency & Renewable Energy, via Data.gov (CC BY 4.0), 2024-06-14)
- IAC_Database.zip (Industrial Assessment Centers Database, 2023-11-20 file) (U.S. Department of Energy, via Open Energy Data Initiative (CC BY 4.0), 2023-11-20)
- IAC Assessment Database Manual, Version 10.2 (Center for Advanced Energy Systems, Rutgers University, for the U.S. Department of Energy, October 2011)
- Industrial Assessment Center (IAC) Operations Manual (Industrial Assessment Center, West Virginia University, and Oak Ridge National Laboratory, November 2016)
- Energy Savings Opportunity Scheme (dataset: Phase 3 notifications, action plans and first progress updates, files dated 2026-06-05) (Environment Agency (Open Government Licence v3.0), Updated 24 September 2026)
- The Energy Savings Opportunity Scheme Regulations 2014, regulations 34A and 34B (legislation.gov.uk (Open Government Licence v3.0))
- Energy Savings Opportunity Scheme: post-implementation review 2025 (Department for Energy Security and Net Zero (Open Government Licence v3.0), 2025-07-18)
- Research on energy audits and reporting, including the Energy Savings Opportunity Scheme (ESOS): Phase 2 final report (BEIS Research Paper 2020/005) (Department for Business, Energy and Industrial Strategy (Open Government Licence v3.0), February 2020)
- Feiten en cijfers energiebesparingsplicht (facts and figures, energy-saving obligation) (Netherlands Enterprise Agency (RVO), checked 2 July 2026)
- Gegeven antwoorden per toepasselijke erkende maatregel, 1 mei 2026 (answers per applicable recognised measure) (Netherlands Enterprise Agency (RVO), 2026-05-01)
- Resultaten energiebesparingsplicht (results of the energy-saving obligation) (Netherlands Enterprise Agency (RVO), March 2026)